Exploring ECG in 2 minutes

Exploring biomedical signals doesn’t have to mean wrestling with complex scripts or MATLAB toolboxes.
In this post, we’ll use PhysioNet - the largest public database of physiological signals - to see how D2xlab can quickly load, align and vizualise ECG and related sensor data. We will demonstrate how to use D2xlab’s parsing options, the resampling feature and finally how to produce a combined dataset.
Data source
We are going to use a dataset1 that features simultaneous recording of electrocardiograph, phonocardiograph, photoplethysmograph and accelerometer. The dataset is split into a number of records, each record being described by four CSV files, one for each recorded instrument. For this example, we’ll load the first record: acc, ecg,pcg, ppg
Loading and parsing the data
Each CSV file is simple: it starts with a header line where t represents the time, followed by the names of the recorded signals, as shown below:
t, lead_I, lead_II, v3, v4
1.9, -119138, -141424, 91895, 87150
3.9, -120543, -142435, 91599, 87010
5.9, -120802, -142617, 91577, 87003
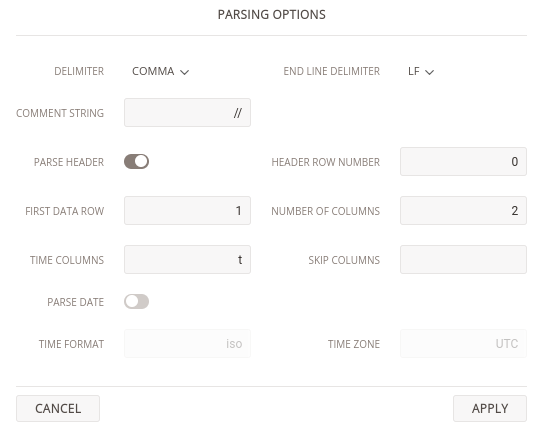
7.9, -121571, -143106, 91581, 87024Drag and drop the first file into the D2xlab window, a dialog box will open with the available Parsing Options. By default, D2xlab looks for a header containing the keyword time. Since our file uses t instead, we need to specify that t is the time column. Once configured, D2xlab will remember your parsing options so reopening similar files will automatically apply the same settings.
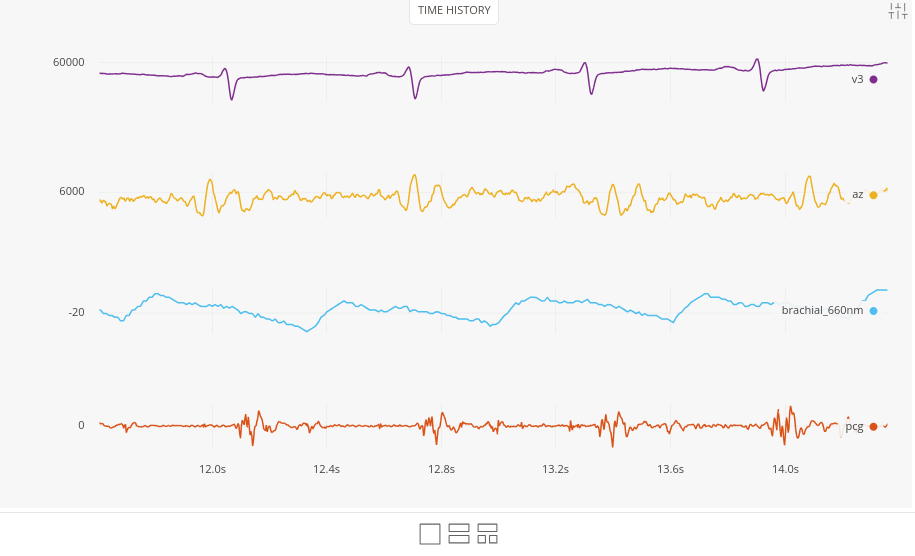
After loading completes, you’ll see that four signals have been created. Double clicking any of them displays it on the time history plot. However, the time span looks suspiciously long — what’s going on? The issue is that D2xlab assumes time values are in seconds, while our files use a different unit.
Adjusting the sampling rate
According to PhysioNet, the ECG signals were acquired at 500 Hz — which means our time values are actually in milliseconds. That’s not a problem. Let’s use D2xlab’s resampling feature. Click on the sampling frequency (bottom right of the status bar) to open the Resample dialog.
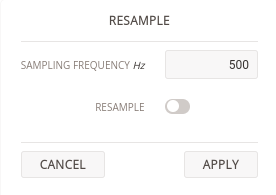
Set the frequency to 500 Hz, but leave the Resample switch off. We only want to reinterpret the time step, not resample the actual values.Then click Apply. Finally, set the origin to 0, since the first time step in the file was not zero and was initially misinterpreted as seconds.
Loading all other files
Repeat the same process for the three other files, taking care to adjust both the sampling frequency and origin. After loading all four datasets, you should see each group of signals ready for viewing.
Merging signals into one dataset
It’s often useful to export all signals into a single file sharing the same time vector. That’s easy to do in D2xlab. You can copy and paste one or more signals from one dataset (collection) to another. Note, however, that if the source and destination have different time spans, the signal may be truncated or zero-padded. In our case, the ECG dataset is the shortest, so we’ll copy all other signals into it. To copy, select one or more signals in the explorer (hold shift key to select multiple), then right click > copy. Next, move your cursor to the destination dataset and right click > paste.

Finally export a combined CSV file by selecting Save To Local Drive from the left-hand menu. If you want to give the file a custom name, rename the dataset in the explorer before saving.
In just a few minutes, we’ve:
- Loaded multi-sensor data from PhysioNet
- Parsed nonstandard CSV headers
- Adjusted sampling frequency and time unit
- Merged multiple signals into a single dataset
all interactively, right inside your browser with D2xlab.
Creative Commons Attribution 4.0 International Public License.↩