Working with NOAA Meteorological Buoy Historical Data

NOAA NDBC is the main public portal for accessing meteorological and oceanographic buoy data. It provides both real-time and historical measurements from a global network of stations.
This short post shows how to use D2xlab to load historical data, parse complex time formats, handle invalid values, fill missing data (NaN), and visualize distributions — all within a few clicks.
California Wave Climate Example
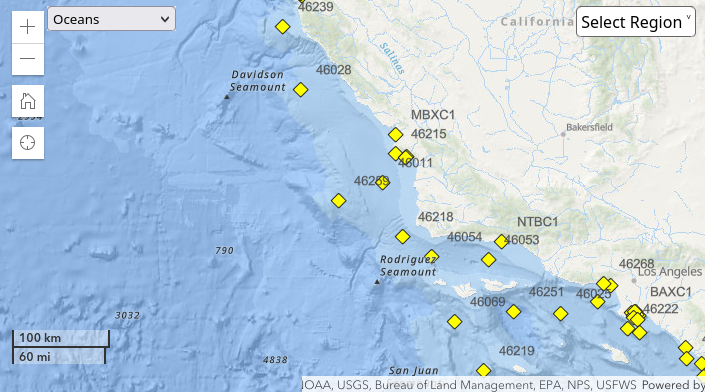
We’ll look at the wave climate offshore California by comparing data from two NOAA wave buoys (46011 and 46028) over 2022.
Here’s their approximate location:
Download both datasets and save them locally as .txt files.
Loading the Data
The NOAA files are space-delimited tables with a two-line header — the first line lists the column names, and the second specifies the units:
                #YY  MM DD hh mm WDIR WSPD GST  WVHT   DPD   APD MWD   PRES  ATMP  WTMP  DEWP  VIS  TIDE
                #yr  mo dy hr mn degT m/s  m/s     m   sec   sec degT   hPa  degC  degC  degC   mi    ft
                2022 01 01 00 00 325 11.6 14.2 99.00 99.00 99.00 999 1010.6 999.0 999.0 999.0 99.0 99.00
                2022 01 01 00 10 321 12.4 15.1 99.00 99.00 99.00 999 1010.7 999.0 999.0 999.0 99.0 99.00
                2022 01 01 00 20 326 11.8 14.5 99.00 99.00 99.00 999 1010.8 999.0 999.0 999.0 99.0 99.00
                2022 01 01 00 30 321 12.5 15.9 99.00 99.00 99.00 999 1010.8 999.0 999.0 999.0 99.0 99.00
                2022 01 01 00 40 324 12.0 15.7  3.13  7.69  6.30 308 1010.9 999.0 999.0 999.0 99.0 99.00
                2022 01 01 00 50 322 12.7 16.0 99.00 99.00 99.00 999 1010.9 999.0 999.0 999.0 99.0 99.00
Drag and drop the file into D2xlab then fine-tune the parsing options. D2xlab detects 18 columns and the proper delimiter, but cannot automatically determine the time column because it spans multiple columns.
That’s fine, D2xlab can combine several columns into a single datetime. Here’s how:
- Enable the Parse Header and Parse Date
- In the Time Columns field, list the names of the date/time columns (comma-separated).
- Specify the datetime format using the standard syntax described in the documentation
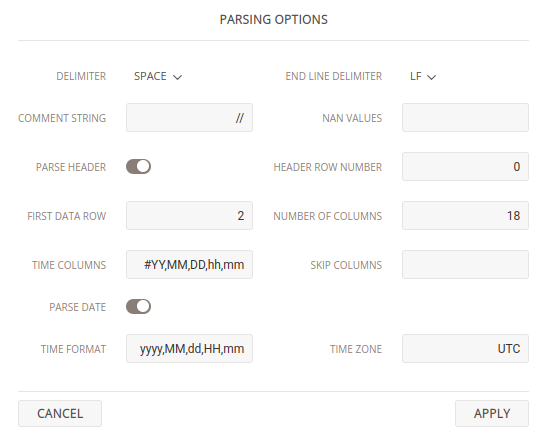
Once loaded, you should see 13 usable series (18 minus the 5 date/time columns).
However, when you double-click WTMP (water temperature) and WVHT (wave significant height) and activate the Multiplot options in the Time History plot, the initial plots look off — values jump erratically.
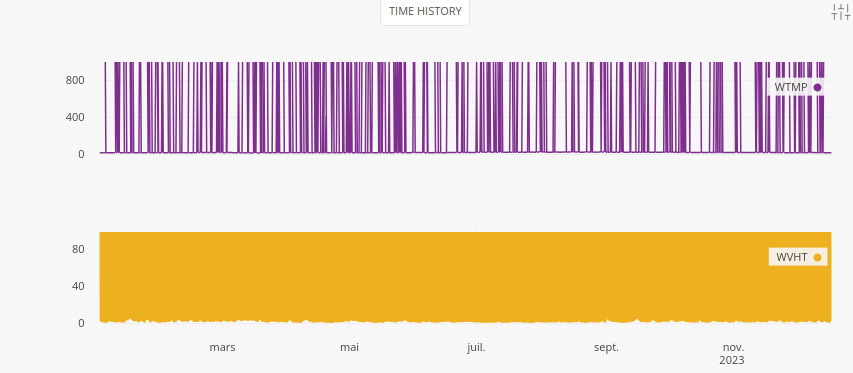
Fixing Invalid Values
If you look at the raw data, you’ll notice placeholders such 99.00 or 999 …These represent missing or invalid measurements, typically when sensors were offline.
To clean this up, D2xlab can automatically replace predefined numeric strings with NaN during import. Just enter 99.00, 999, 999.0, 99.0 in the NAN VALUES field.
Re-importing the file with this setting removes the spurious values and reveals much cleaner time histories.
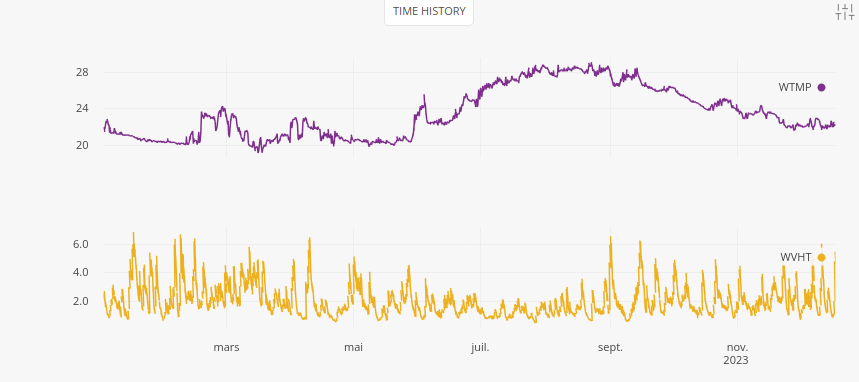
Still, you may see discontinuities at high zoom factor. For example, WVHT has valid points separated by invalid ones, making line plots appear empty.
Turn on Draw Markers in the Time History plot options to visualize isolated points properly.
(Note: D2xlab uses smart decimation to keep rendering smooth, so missing data may only become visible when zoomed in.)
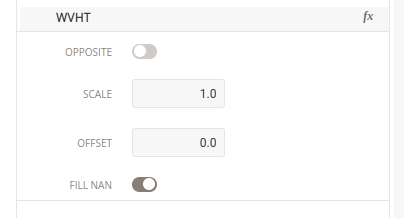
Filling NaN
While D2xlab handles NaN gracefully, sometimes it’s useful to fill gaps with interpolated values.
You can do this non-destructively using Online Filters.
Let’s try it:
- Diplay VWHT on the Time history plot (zoomed-in) with markers on.
- Click the Filter icon next to WVHT in the explorer.
- Toggle Fill NaN on and off to see how D2xlab interpolates between valid points.
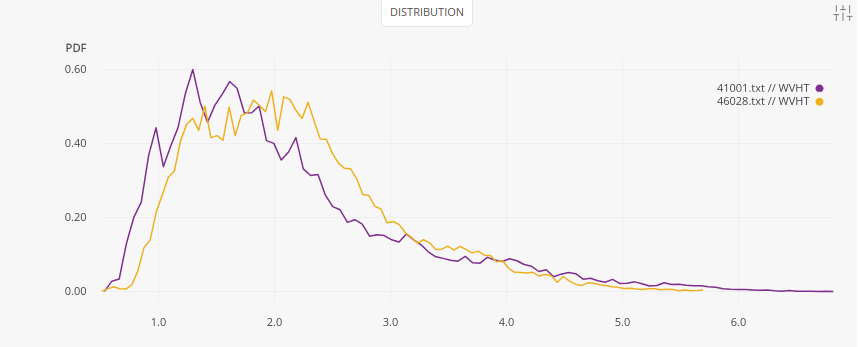
Comparing Wave Distribution
Now, repeat the process with the second buoy dataset. Once both are loaded, use the Distribution plot to compare the 2022 wave-height distributions between the two sites.
You’ll see that median wave heights tend to be higher at buoy 46028, a simple but insightful comparison achieved in just a few clicks.
Take Away
In this post, you learned how to:
- Parse multi-column timestamps
- Define custom NaN values
- Clean and fill missing data
- Quickly compare datasets from multiple sources
All without leaving D2xlab, an efficient tool for anyone exploring environmental, oceanographic, or sensor-based datasets.