
logo

Explore time series data instantly, in your browser.

Built for engineers working with simulation and measurement data.

No signup to get started. Free account required for sharing.

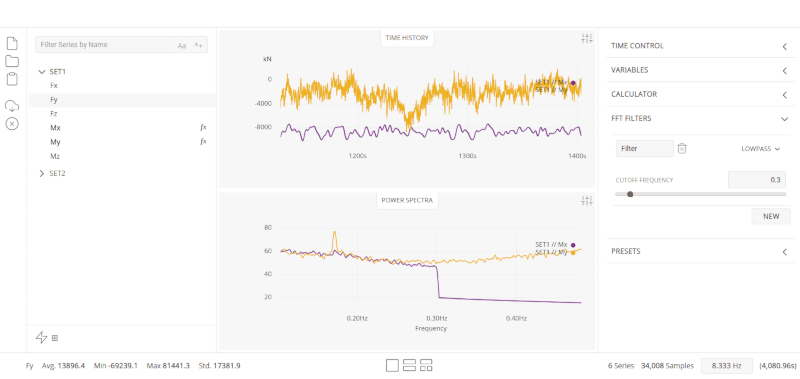
Screenshot of the application
When Excel is clunky and Python feels like overkill, D2xlab lets you inspect, analyze, and share your data in seconds.

Import fast

Drag & drop CSV and other text files or paste raw data and benefit from instant yet flexible parsing.

Visualize powerfully

Time series plots , PSD plots and spectrogram with smooth zoom and pan.

Share your analysis

Generate a link and let anyone explore the same plots and derived signals directly in their browser. Free account required.

Edit non-destructively

Apply filters, scale, offset or combine signals without overwriting.

Create with expressions

Define new series using math expressions, recalculates automatically.

Save time with presets

Store your editing workflows and reuse them in one click.

Scales with your data

Handles millions of points and hundreds of series, right in the browser.

Privacy first

Analyze locally. Upload only the datasets you decide to share.

Explore the blog for quick tutorials, real datasets, and use cases that show what D2xlab can do.

Discover how D2xlab reduces dataset size by more than 3× using integer block coding, enabling faster sharing with virtually no loss of useful information.

Learn how to use D2xlab to explore accelerometers dataset and show how simple numerical operators — forward differences, cumulative sums, and FFT filtering — can be combined.

Compare OrcaFlex simulations instantly in D2xlab — copy and paste your time-history results directly from the clipboard, visualize signals side by side, and skip the export/import hassle.

Learn how to load, clean, and compare NOAA buoy data in D2xlab — from parsing multi-column timestamps to filling missing wave records.